Troubleshooting
This article provides troubleshooting information for various tools and features in Pomerium.
Pomerium Zero
Configure port 443 to allow inbound access
Problem
Whenever you deploy a cluster, the Pomerium Zero cloud sends an inbound request to the cluster on port 443 to establish a secure connection. This is the default behavior. If the port is unavailable (for example, another process is already listening on port 443, or you haven't allowed a non-root process to bind to port 443), Pomerium Zero won't be able to establish a connection to your cluster.
Solution
Open the port so that it grants Pomerium inbound access on port 443. (For example, you can do this in Linux systems with the CAP_NET_BIND_SERVICE capability.)
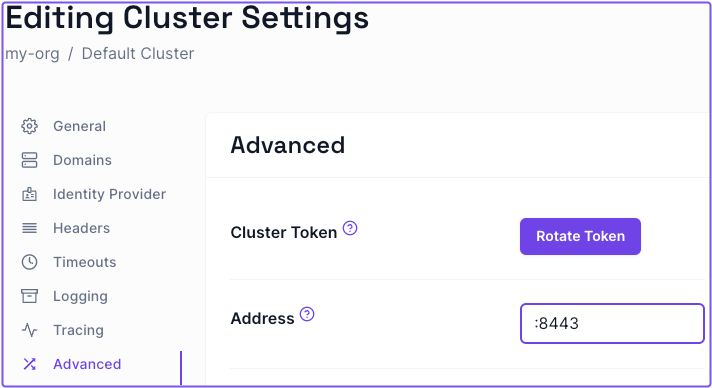
If you've reserved port 443 for something else, you can change the port Pomerium sends inbound requests to by specifying a different listening port (like :8443) in the Address field of the Zero Console:
- Select Settings
- Select Advanced
- Enter the preferred port address
- Apply your changes

Pomerium Zero also makes several outbound connections to the following pomerium.app domains on port 443 to fetch a cluster's configuration and status:
- console.pomerium.app:443
- connect.pomerium.app:443
- telemetry.pomerium.app:443
Delete a cluster
At some point, you may want to delete a cluster. Currently, you can only delete a cluster if you have multiple clusters.
To delete a cluster:
- Select the clusters dropdown in the Zero Console navigation bar
- Select Manage Clusters
- Select the checkbox next to the cluster you want to delete, then select the Delete button in the table
- In the popup, select Delete to confirm
Pomerium Zero loses configuration after upgrading
If you installed Pomerium using the Linux install script during the Pomerium Zero beta, you will need to re-run the install script the first time you upgrade Pomerium. (Subsequent upgrades will not require this step.)
- First, find your current cluster token: look for a line beginning with
Environment=POMERIUM_ZERO_TOKEN=in the file/usr/lib/systemd/system/pomerium.service. - Copy this token into the following command and run it:
$ curl https://console.pomerium.app/install.bash | \
  env POMERIUM_ZERO_TOKEN=<cluster_token> bash -s install
Pomerium Core
JWT Authentication
When securing the Pomerium Authenticate service with a certificate signed by Let's Encrypt, your upstream applications may reject the certificate when attempting to access the JWT signing key. Here's an example log line from Grafana:
logger=context error=Get "https://grafana.localhost.pomerium.io/.well-known/pomerium/jwks.json": x509: certificate signed by unknown authority
This is often due to the recent expiration of the DST Root CA X3 certificate. Many default keystores used by docker images and less-frequently updated distributions still carry this expired certificate. Even though Let's Encrypt certs are cross-signed with the ISRG Root X1 CA certificate, some applications will still reject them.
To clarify; this does not mean that the upstream service is rejecting the JWT signing key. Rather, it doesn't trust the Let's Encrypt certificate used by the Authorize service for TLS, and so it will not read the JWKS file.
For upstream applications that can use a local signing key file, you can circumvent this issue using curl or wget to download the signing key locally (relative to the upstream service). Using Grafana again as an example:
-
Download the
jwks.jsonfile from the authenticate server:- curl
- wget
curl https://grafana.localhost.pomerium.io/.well-known/pomerium/jwks.json > /etc/grafana/jwks.jsonwget -O /etc/grafana/jwks.json https://grafana.localhost.pomerium.io/.well-known/pomerium/jwks.json -
Edit the upstream service configuration to use the local key to verify tokens:
[auth.jwt]
enabled = true
header_name = X-Pomerium-Jwt-Assertion
email_claim = email
jwk_set_file = /etc/grafana/jwks.json
cache_ttl = 60m
Kubernetes Ingress Controller
View Event History
Pomerium Ingress Controller will add events to the Ingress objects as it processes them.
kubectl describe ingress/my-ingress
Events:
  Type    Reason   Age   From              Message
  ----    ------   ----  ----              -------
  Normal  Updated  18s   pomerium-ingress  updated pomerium configuration
If an error occurs, it may be reflected in the events:
Events:
  Type     Reason       Age                 From              Message
  ----     ------       ----                ----              -------
  Normal   Updated      5m53s               pomerium-ingress  updated pomerium configuration
  Warning  UpdateError  3s                  pomerium-ingress  upsert routes: parsing ingress: annotations: applying policy annotations: parsing policy: invalid rules in policy: unsupported conditional "maybe", only and, or, not, nor and action are allowed
Shared Secret Mismatch
Pomerium's independent services communicate securely using a shared secret. When services or the databroker have mismatched secrets, Pomerium will fail.
Pomerium Core will log a shared secret mismatch with:
{
  "level": "error",
  "syncer_id": "authorize",
  "syncer_type": "",
  "error": "rpc error: code = Unauthenticated desc = invalid JWT: go-jose/go-jose: error in cryptographic primitive",
  "time": "2022-03-22T07:26:14-04:00",
  "message": "sync"
}
And Pomerium Enterprise will log the error with:
{
  "level": "error",
  "ts": "2022-03-22T07:21:02-04:00",
  "caller": "dashboard/server.go:187",
  "msg": "syncer",
  "error": "failed to sync all devices: rpc error: code = Unauthenticated desc = invalid JWT: go-jose/go-jose: error in cryptographic primitive",
  "stacktrace": "github.com/pomerium/pomerium-console/svc/dashboard.(*Server).Run.func2\n\t/PATH/TO/POMERIUM/CONSOLE/SERVICE/svc/dashboard/server.go:187\ngolang.org/x/sync/errgroup.(*Group).Go.func1\n\t/Users/tgroth/workspace/go/pkg/mod/golang.org/x/sync@v0.0.0-20210220032951-036812b2e83c/errgroup/errgroup.go:57"
}
{
  "level": "info",
  "ts": "2022-03-22T07:21:02-04:00",
  "caller": "dashboard/server.go:202",
  "msg": "stopping dashboard servers"
}
Update the shared secret across all Pomerium services to match the one set for the Databroker.
RPC Errors
certificate signed by unknown authority
When authenticating and authorizing a user for the first time, you may see the following in your Pomerium logs:
ERR http-error error="401 Unauthorized: ..... rpc error: code = DeadlineExceeded desc = latest connection error: connection error: desc = "transport: authentication handshake failed: x509: certificate signed by unknown authority...."
Why
This error means that the proxy is rejecting the Authorize service's supplied certificate (used to establish a secure connection) because it doesn't know or trust the certificate authority that signed it.
Solution
Ensure that the Proxy service knows about and trusts the certificate authority that signed the Authorize service's certificate.
-
Add the certificate authority directly into Pomerium using the certificate authority config setting.
-
Add the certificate authority to the system's underlying trust store.
-
Replace your system / docker image certificate bundle.
For Docker:
COPY --from=builder /etc/ssl/certs/your-cert-bundle.crt /etc/ssl/certs/ca-certificates.crt -
Finally, ensure that you aren't being man-in-the-middle'd or that some eager router isn't injecting its own certificate along the way. Use openssl to verify that your Proxy service is getting the certificate you think its getting.
openssl s_client -servername pomerium.io -connect pomerium.io:443 </dev/null \
| sed -ne '/-BEGIN CERTIFICATE-/,/-END CERTIFICATE-/p'
rpc error: code = DeadlineExceeded
When authenticating and authorizing a user for the first time, you may get the following in your Pomerium logs.
{"level":"error",..."error":"rpc error: code = DeadlineExceeded desc = context deadline exceeded","http-message":"rpc error: code = DeadlineExceeded desc = context deadline exceeded","http-code":500,"message":"http-error"}
Why
The Proxy service is not able to create a connection with the authorization service to validate a user.
Solution
Usually, this is the result of either a routing issue or a configuration error. Make sure that you are using the internally routable URL for the Authorize service. Many cloud loud balancers do not yet support gRPC transposing the ingress. So while your authenticate service url will probably look like https://authenticate.corp.example.com, your authorizer service url will likely be more like https://pomerium-authorize-service.default.svc.cluster.local or https://localhost:5443.
Pomerium exits on startup
Problem
If you first run the Pomerium process as one Unix user (e.g. root), and then later attempt to run Pomerium as a different user, Pomerium may refuse to start.
Look for a log entry containing an error message like the following:
cannot open shared memory region /envoy_shared_memory_2068293160 check user permissions. Error: File exists
Or a log entry with an error message like this:
cannot bind '/tmp/pomerium-envoy-admin.sock': Address already in use
Solution
Remove the files created while Pomerium was running as the other user:
$ sudo rm /dev/shm/envoy_shared_memory_*
$ sudo rm /tmp/pomerium-envoy-admin.sock
Then start Pomerium again.
Pomerium Enterprise
Generate Recovery Token
In the event that you lose access to the console via delegated access (the policy defined in Pomerium), there exists a fallback procedure to regain access to the console via a generated recovery token.
To generate a token, run the pomerium-console generate-recovery token command with the following flags:
| Flag | Description |
|---|---|
--database-encryption-key | base64-encoded encryption key for encrypting sensitive data in the database. |
--database-url | The database to connect to (default "postgresql://pomerium:pomerium@localhost:5432/dashboard?sslmode=disable"). |
--namespace | The namespace to use (default "9d8dbd2c-8cce-4e66-9c1f-c490b4a07243" for Global). |
--out | Where to save the JWT. If not specified, it will be printed to stdout. |
--ttl | The amount of time before the recovery token expires. Requires a unit (example: 30s, 5m). |
You can run the pomerium-console binary from any device with access to the database.
Directory sync
Problem:
Enterprise Console directory sync fails to complete.
Solution:
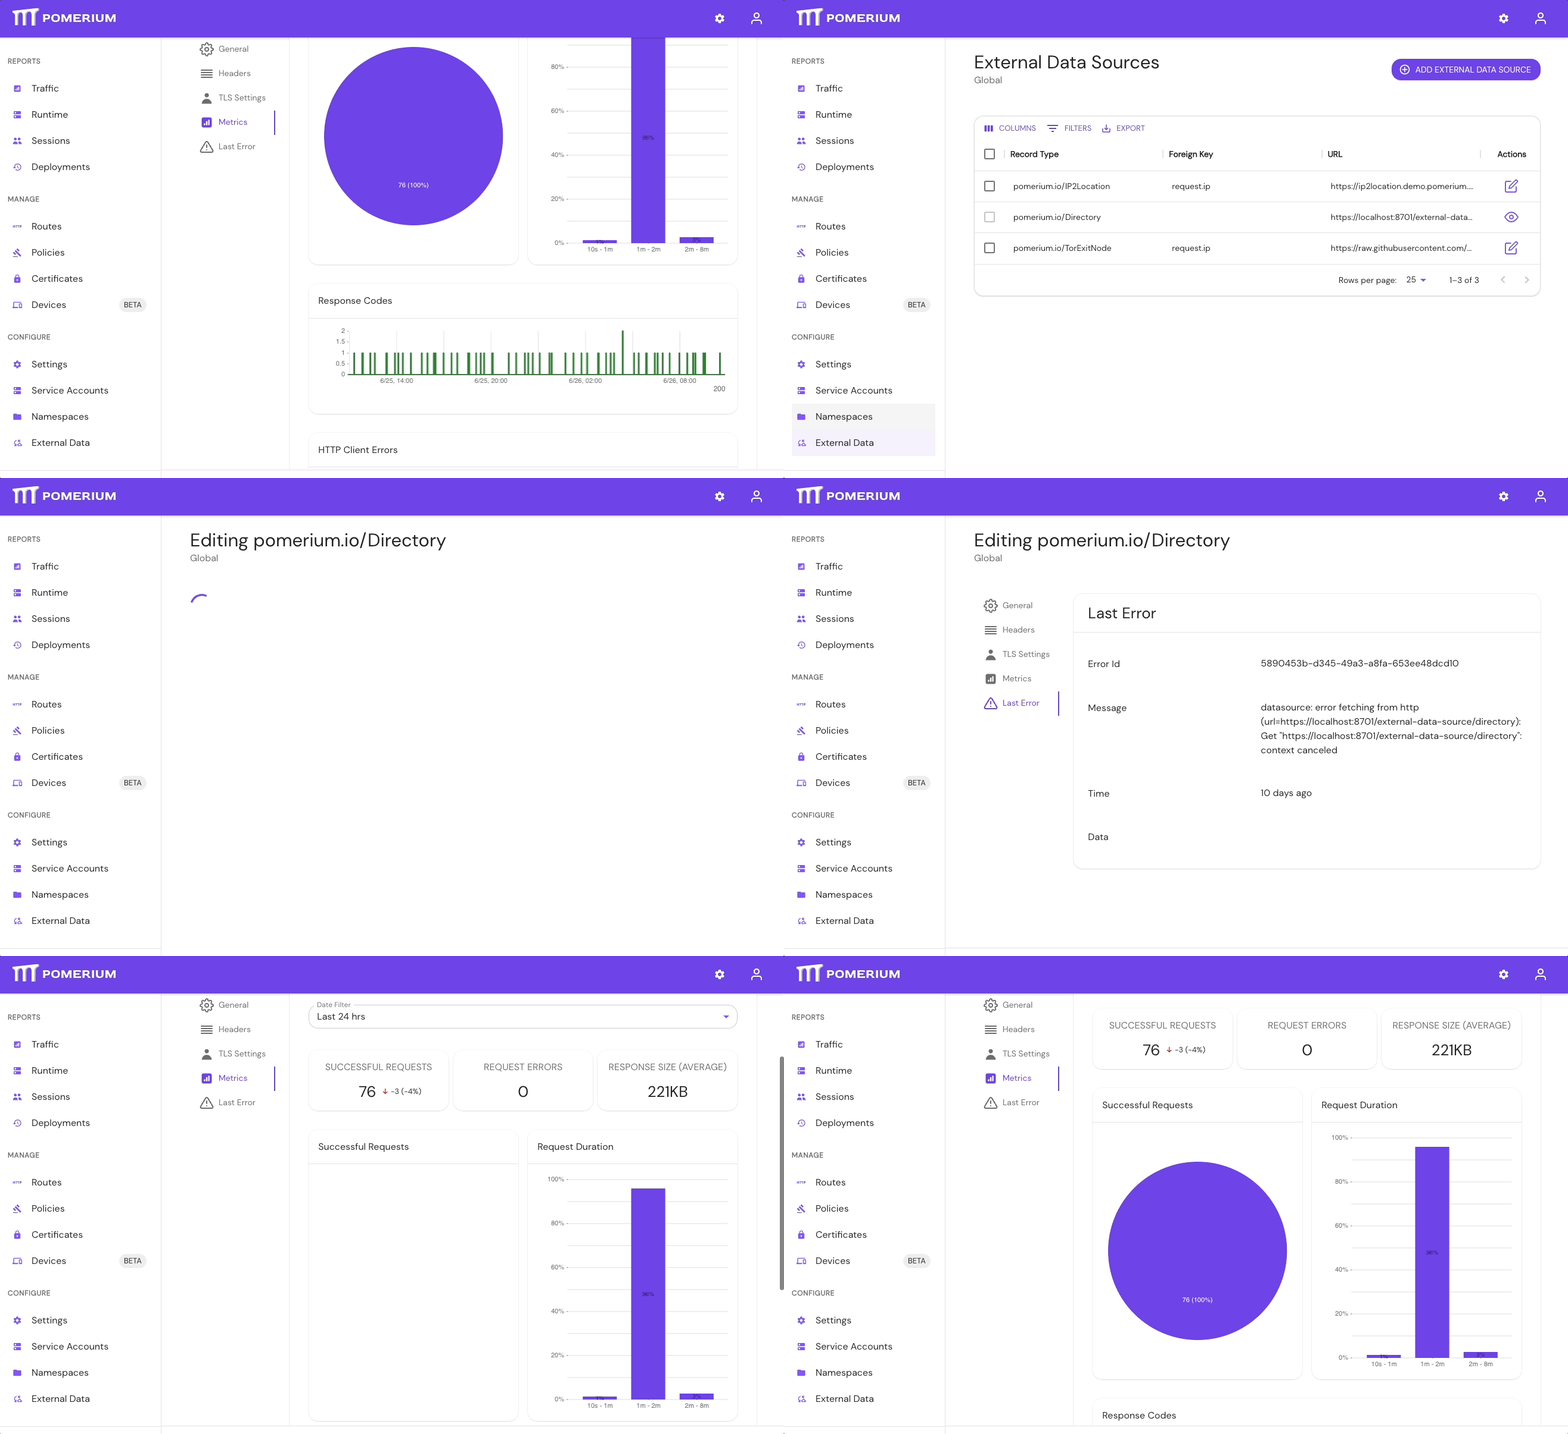
If your directory sync fails, use the External Data > Last Error and Metrics dashboards to determine the source of the failure, and review your Console logs as well. If the failure is due to a timeout, increase the IdP Polling Min/Max Delay settings until the sync completes.
- In the Console, go to External Data > Last Error to check for errors that may have caused the sync to fail. Go to External Data > Metrics to review request durations:

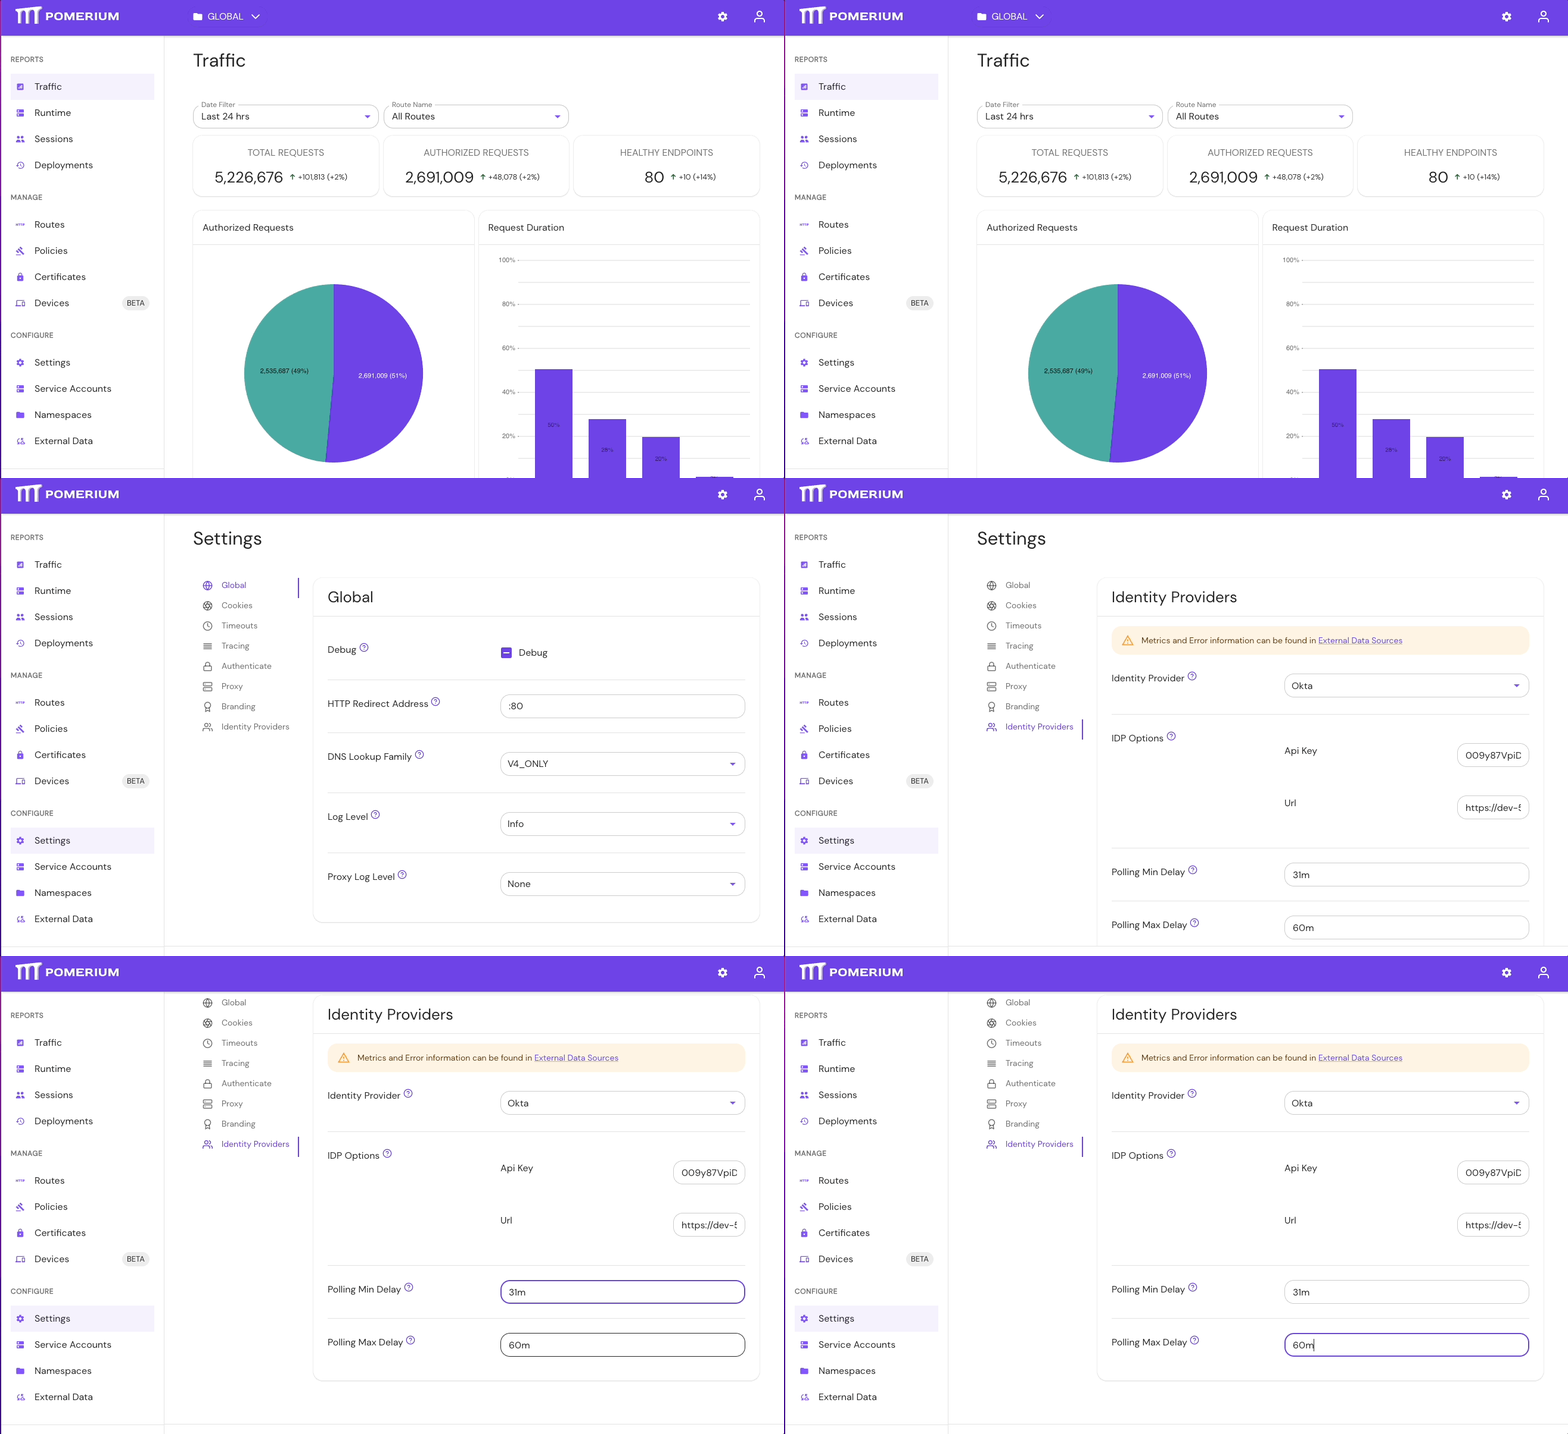
- Select Settings > Identity Providers to see the IdP Polling Min/Max Delay settings. Increase the Polling Min Delay and Polling Max Delay settings before attempting to sync your directory again. Continue to monitor the sync; if it fails due to timeout, increase the durations.

See Identity Provider Polling Min/Max Delay for more information.
Case sensitive values
Configuration file keys and environment variables of the type string are case sensitive. This is important when configuring the Enterprise Console or adding claims to your configuration file.
For example, the administrators key allows you to specify a list of names, email addresses, or user IDs as initial administrators to access and configure the Enterprise Console. These string values are case sensitive.
If you wanted to add an email address like John.Admin@example.com to the administrators file key, Pomerium wouldn't recognize an email like john.admin@example because the strings aren't an exact match.
Upstream connection errors
Upstream connection errors indicate that something is wrong with the upstream server, not Pomerium. Please refer to the list of errors below to learn more about a specific issue, and how you can resolve it.
Configuration errors in Pomerium itself can also cause upstream connection errors. In this case, you'd need to debug your Pomerium configuration to resolve the error.
No healthy upstream
The no_healthy_upstream error means that there is an issue with the upstream server that makes it unreachable from Pomerium. The error may be caused by or related to the upstream server's:
-
Configuration or application code
Resolution: Check that there are no errors in the server's configuration files or application code that prevent it from running as expected.
-
Network or firewall settings
Resolution: Check your network or firewall settings to make sure your server is reachable.
-
DNS records
Resolution: This error may be caused by unresolvable DNS records applied to the upstream server. Make sure the server's DNS records are pointing to the correct IP address.
-
Failing health checks configured in Pomerium
Resolution: If you've configured Load Balancing Health Checks in Pomerium, the
no_healthy_upstreamcould be the result of a failing health check from an upstream server. Please check the server's configuration for any errors.
Upstream Max Stream Duration Reached
The upstream_max_stream_duration_reached error means that Pomerium cancelled the request because it exceeded the upstream server's maximum stream duration.
Resolution: By default, Pomerium sets a 10-second timeout for all requests. If your requests are taking longer than expected, see the Connections - Timeouts page to learn how timeouts work with upstream connections, and how to configure timeouts to avoid this error.
Upstream Per Try Timeout
The upstream_per_try_timeout error means that the final attempt to connect to the upstream server timed out.
Resolution: See the Connections - Timeouts page to learn how timeouts work with upstream connections, and how to configure timeouts in Pomerium to avoid this error.
Upstream Reset After Response Started
The upstream_reset_after_response_started error means that the upstream server reset the connection after it began transmitting the response.
Resolution: See the Connections - Timeouts page to learn how timeouts work with upstream connections, and how to configure timeouts in Pomerium to avoid this error.
Upstream Reset Before Response Started
The upstream_reset_before_response_started error means the upstream server reset the connection before it began transmitting the response.
Resolution: See the Connections - Timeouts page to learn how timeouts work with upstream connections, and how to configure timeouts in Pomerium to avoid this error.
Upstream Response Timeout
The upstream_response_timeout error means that the upstream server's response timed out.
Resolution: See the Connections - Timeouts page to learn how timeouts work with upstream connections, and how to configure timeouts in Pomerium to avoid this error.
Via Upstream
The via_upstream error means that the upstream service set the response code.
Resolution: To resolve this error, check the upstream service's application logs for more information about how the response status code is set.
Miscellaneous
Invalid Certificates from Command Line Tools
When using Let's Encrypt certificates, you must use the fullchain.pem file, not cert.pem in order to include intermediate certs. Browsers like Chrome will store intermediate certs for LE but other tools (like curl) don't, which is why your route might look fine in a web browser, but not when curl'd or used for TCP tunneling.
Handle self-signed certificate warning
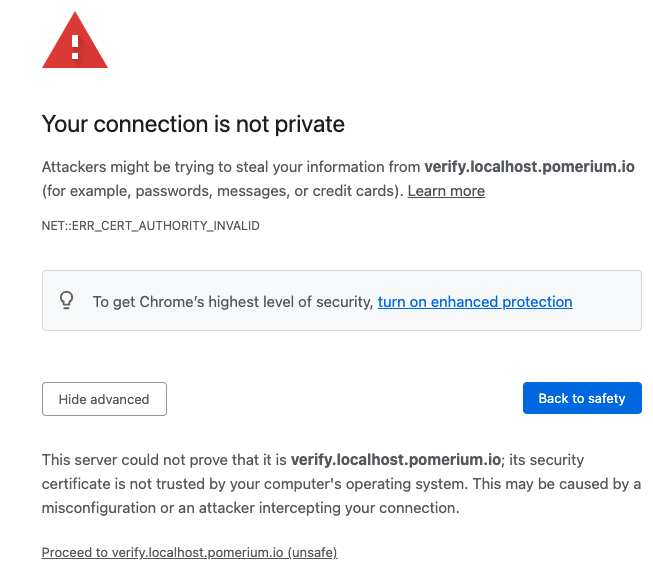
If you're testing Pomerium locally with self-signed certificates, you may encounter the following self-signed certificate warning:

To resolve this error:
- Select Advanced
- Select Proceed to verify.localhost.pomerium.io (unsafe)
If you don't see an Advanced option:
- Click anywhere in the window
- Type
thisisunsafe - Make sure Reload is selected
- Select Enter
Your browser will redirect you to the route defined in your policy.